Classes use energy dashboard to study conservation
By Sarah Cutler

Thanks to a new online dashboard, facilities staff in the College of Human Ecology can view real-time data on water and energy consumption in the LEED Platinum-rated Human Ecology Building (HEB).
Students and professors in the Department of Design and Environmental Analysis are also plugging in, using the interface as a learning tool to study optimal dashboard design for building occupants and to test how building energy dashboards can steer conservation campaigns.
Their findings have helped guide the development of a broader campuswide energy dashboard system overseen by Cornell Facilities Services, a tool set to launch later this spring that will provide instantaneous energy usage data for some 50 campus locations.
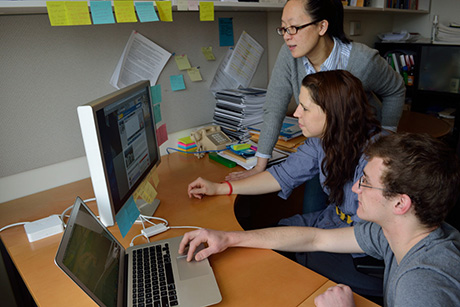
Last fall, students in assistant professor of design and environmental analysis Ying Hua’s course Collaborative Sustainable Building Practice evaluated the HEB dashboard and a separate online dashboard platform, comparing the structure, information presentation and user-friendliness of each.
In collaboration with the Energy and Sustainability Department in Facilities Services, Hua asked students to evaluate each platform from the perspectives of facilities staff, the general public and specific occupants. Class members held focus groups and studied dashboard conventions, compiling their findings into a report for college and university facilities leaders.
“Student input and evaluation of the energy dashboards really helped Facilities Services decide which dashboard would be right for Cornell,” said Erin Moore, energy outreach coordinator for Facilities Services. “Professor Hua’s students were really enthusiastic about gaining hands-on experience with a real-time energy dashboard and learning how the system plays a role in building performance.”
Hua noted that the project also helped students envision uses for such dashboards, including connecting individual actions to a facility’s total energy usage.
“My understanding is, people see it as a big screen showing yearly trends,” Hua said. “But that’s only a fraction of what the dashboard can do. The dashboard gives me the chance to talk about building energy consumption and profiles of energy use in a context that students are very familiar with. It’s definitely helped students understand things better.”
By the end of Hua’s class, Raechel Schneider, a graduate student in the field of facilities planning and management, said she realized that a dashboard offers a powerful feedback loop to encourage building occupants to turn off lights, power down unneeded equipment and conserve resources in lab spaces.
“This board lets people be engaged,” she added. “We’re usually pretty passive users of buildings, but the dashboard allows for active use. That’s something I’d like to see more of, both on college campuses, in office spaces – any type of user group can benefit from it.”
Will Higgins ’14, also enrolled in Hua’s course, credited the project with shedding light on how different groups use an energy dashboard.
“For students, you want it to be really quick, with basic info on the front page,” he said. “For facility managers, you want people to be able to dive in a little more – depth you wouldn’t want on the front page. You want energy use by floor, by plug load, by lighting.”
This semester, Hua will incorporate the dashboard into another of her courses, Introduction to Building Technology, to further explore how energy-monitoring systems can spur occupants to reduce consumption. In the long term, Hua said, she plans to try using the dashboard to run simulations for illustrating the effect of various energy-saving scenarios.
Sarah Cutler ’16 is a student communications assistant for the College of Human Ecology.
Media Contact
Get Cornell news delivered right to your inbox.
Subscribe