Data visualization could reveal nature of the universe
By Melanie Lefkowitz
As cosmologists ponder the universe – and other possible universes – the data available to them is so complex and vast that it can be extremely challenging for humans alone to comprehend.
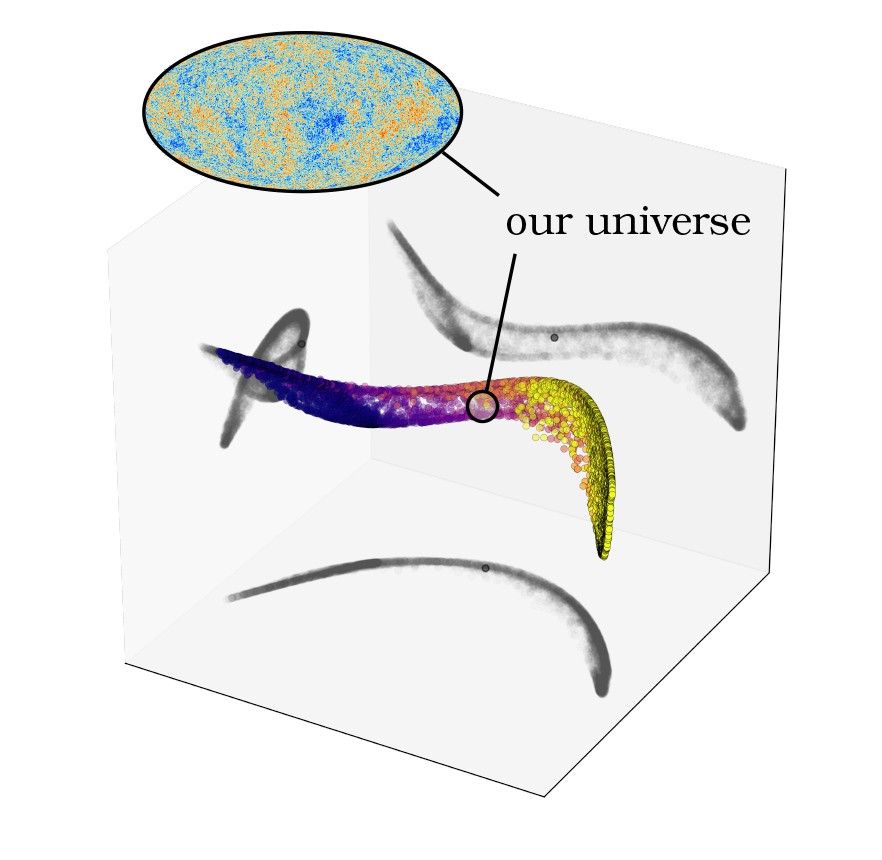
A visualization showing predictions of what patterns of cosmic microwave background – radiation left over from the Big Bang – would look like in different universes, with the patterns of our own universe depicted in a single point.
In applying scientific principles used to create models for understanding cell biology and physics to the challenges of cosmology and big data, Cornell researchers have developed a promising algorithm to map a multifaceted set of probabilities.
The new method, which researchers have used to visualize models of the universe, could help solve some of physics’ greatest mysteries, such as the nature of dark energy or the likely characteristics of other universes.
“Science works because things behave much more simply than they have any right to,” said James Sethna, professor of physics and senior author of “Visualizing Probabilistic Models With Intensive Principal Component Analysis,” which published online June 24 in the Proceedings of the National Academy of Sciences. “Very complicated things end up doing rather simple collective behavior.”
That, he said, is because not every factor in a system is significant. For example, millions of atoms may be involved in a physical collision, but their behavior is determined by a relatively small number of constants. Data about the universe collected by powerful telescopes, however, has so many parameters it can be challenging for researchers to figure out which measurements are most important to reveal insights.
The algorithm – developed by first author Katherine Quinn, M.S. ’16, Ph.D. ’19 – allows researchers to image a large set of probabilities to look for patterns or other information that might be useful – and provides them with better intuition for understanding complex models and data.
“As we have much bigger and better datasets, with terabytes and terabytes of information, it becomes more and more difficult to actually make sense of them,” Quinn said. “A person can’t just sit down and do it. We need better algorithms that can extract what we’re interested in, without being told what to look for. We can’t just say, ‘Look for interesting universes.’ This algorithm is a way of untangling information in a way that can reveal the interesting structure of the data.”
Further complicating the researchers’ task was the fact that the data consists of ranges of probabilities, rather than raw images or numbers. “It’s a trickier problem to handle,” Quinn said.
Their solution takes advantage of different properties of probability distributions to visualize a collection of things that could happen. In addition to cosmology, their model has applications to machine learning and statistical physics, which also work in terms of predictions.
To test the algorithm, the researchers used data from the European Space Agency’s Planck satellite, and studied it with co-author Michael Niemack, associate professor of physics, whose lab develops instruments to study the formation and evolution of the universe by measuring microwave radiation. They applied the model to data on the cosmic microwave background – radiation left over from the universe’s earliest days.
The model produced a map depicting possible characteristics of different universes, of which our own universe is one point. This new method of visualizing the qualities of our universe highlights the hierarchical structure of the dark energy and dark matter dominated model that fits the cosmic microwave background data so well. While the structure isn’t surprising, these visualizations present a promising approach for optimizing cosmological measurements in the future, Niemack said.
Next, the researchers will try to expand this approach to allow for more parameters for each data point. Mapping such data could reveal new information about our universe, other possible universes or dark energy – which appears to be the dominant form of energy in our universe but about which physicists still know little.
“We use only crude models to explain what dark energy could be, or how it could be evolving with time,” Niemack said. “There are a whole slew of different parameters that could be added to the models, and then we could visualize those and decide which are the important measurements to prioritize, to try to understand which model of dark energy best describes our universe.”
Other contributors were doctoral student Colin Clement and former Cornell research associate Francesco De Bernardis. The research was partly supported by the National Science Foundation and the Natural Sciences and Engineering Research Council of Canada.
Media Contact
Get Cornell news delivered right to your inbox.
Subscribe