Throwing shade: Model maps NYC street trees’ cooling benefits
Throwing shade: Model maps NYC street trees’ cooling benefits
By James Dean, Cornell Chronicle
Cornell researchers’ “leaf-level” visualization of every tree in New York City – and how much shade each provides – could inform new strategies for mitigating extreme heat there, and in other cities coping with record-breaking temperatures.
Tree Folio NYC creates a “digital twin” of New York’s urban canopy. The high-resolution, 3D model not only details trees’ location, type and size, but simulates how local conditions such as street orientation, street width and building height influence their shading benefits.
For decades, cities have planted trees in uniform rows along streets. But improved understanding of how tree placement impacts shading could help planners plant and maintain trees more strategically to maximize climate benefits and distribute them equitably, said Alex Kobald, project lead and associate director of the Design Across Scales Lab in the College of Architecture, Art and Planning (AAP).
“We’re trying to better understand the relationship between a tree and its local environment,” Kobald said, “and how that local environment impacts the benefits a tree can provide.”
The lab led by J. Meejin Yoon, B.Arch. ’95, the Gale and Ira Drukier Dean of AAP, investigates spatial, social, and environmental challenges at the intersection of the built environment, ecology, and technology. Tree Folio, NYC explores the street tree and urban canopy as a form of city infrastructure. The project was developed with students and funding from the Design Across Scales Lab at AAP and the Urban Tech Hub, part of the Jacobs Technion-Cornell Institute at Cornell Tech. Kobald has shared early versions with municipal agencies and policy advocates, and said the open-source tool could be scaled to other cities using publicly available data.
The research team launched the web application as many cities are investing in tree cover to reduce vulnerability to warming – July was the hottest month on record globally – and mitigate so-called heat island effects, when building materials absorb and re-emit the sun’s heat. The federal Inflation Reduction Act includes $1.5 billion to improve climate resilience through such initiatives.
“Extreme heat is one of the most acute and lethal risks of climate change, especially for cities, and we have deployable solutions now,” Kobald said. “In cities around the world, urban trees are vital infrastructure for confronting extreme heat events exacerbated by climate change.”
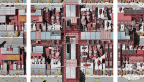
The model is constructed from New York City’s most recent 2021 3D aerial scan of the five boroughs using lidar sensing, short for light detection and ranging. The researchers developed a method to extract the urban forest from the high-resolution survey of the built environment, creating an interactive map of trees viewable from any angle, each a cluster of green data points that resemble leaves.
The lidar scan is linked to the city’s 2015 tree census, which counted more than 666,000 public, curbside trees greening more than 131,000 blocks. Clicking on any tree reveals its address, species, health status, height, canopy radius and trunk diameter, and a planned folio tool would allow comparisons with like trees – honey locusts, say, or pin oaks – in the same ZIP code. Most importantly, Tree Folio, NYC enables users to simulate the shade any street tree produces over an entire year, computing the extent to which it shades public ground or building facades, or lives entirely in shadow itself – thus adding no net cooling benefit.
Urban canopy traditionally is measured as a percentage of an area covered by trees – about 22% of New York overall, a total that advocates propose growing to 30% by 2035. But Kobald said Tree Folio, NYC shows that the quality of that coverage is highly dependent on each individual tree’s local context.
The difference can be seen in a comparison of three neighborhoods that share similar physical characteristics – building heights, street widths and number of trees – but differ in street orientations, socioeconomic status and heat vulnerability indexes.
Prospect Park in Brooklyn, Pelham Gardens in the Bronx and Ozone Park in Queens, Kobald said, have similar numbers of trees but vary drastically in quality and impact. Because trees are larger and more evenly distributed in Park Slope and Pelham Gardens, those neighborhoods see more beneficial shading on streets and buildings. Ozone Park also is significantly more exposed on east-west streets where summer afternoon heat is most intense, increasing its vulnerability.
“It’s not just that there are fewer trees in Ozone Park, but that the trees that are there aren’t in the right places,” Kobald said.
To address such discrepancies, he said, cities might invest in the same number of tree plantings but concentrate them where they can make the biggest difference.
“Cities should be planting green belts rather than green blankets,” he said.
Tree Folio, NYC combines AAP’s spatial understanding of urban data and the environment producing it, Kobald said, and the Urban Tech Hub’s experience working with complex data on a very large scale – some 600 gigabytes involving 150 billion points extracted from 1,800 lidar files.
“It’s been a fantastic collaboration,” he said. Yoon concurred and shared how critical the collaboration was to showcasing how open source data sets can be used, analyzed, and built upon to provide new tools for more equitable and impactful climate mitigation strategies.
The project team also includes research assistants Joe Ferdinando, M.Arch. ’22, M.Eng. ’23; Sarang Pramode, M.S. ’23; Jiahao Dong, M.S. ’23; and graduate student Guangwei Jiang; and advisers Anthony Townsend, urbanist in residence at the Jacobs Technion-Cornell Institute at Cornell Tech, and Yoon.
Media Contact
Get Cornell news delivered right to your inbox.
Subscribe