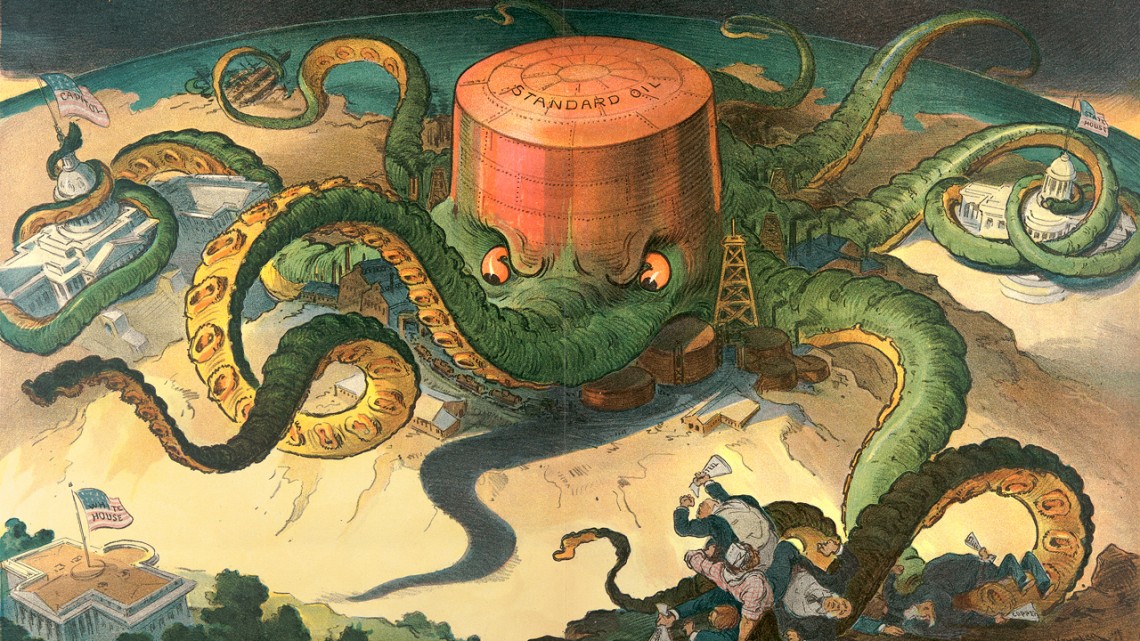
A cartoon map by Joseph Ferdinand Keppler, published eight weeks before the U.S. presidential election in 1904, depicts the now-defunct Standard Oil company exerting tentacles of influence on the U.S. Congress and the White House. It’s part of an exhibit, “Latitude Persuasive Cartography,” which opens Oct. 3 at the Carl Kroch Library’s Hirshland Exhibition Gallery.
New exhibit maps out emotional states
By Jose Beduya
The United States in the shape of a hog, representing the nation’s love of pork.
A mosquito turning continents red with malaria.
Russia seen as an octopus, spreading its tentacles across Europe.
These are just a few images on maps meant to stir public sentiment, which are featured in the new exhibit, “Latitude: Persuasive Cartography,” opening Oct. 3 in Carl A. Kroch Library’s Hirshland Exhibition Gallery.
The pieces on display are a small sampling from the PJ Mode Collection of Persuasive Cartography, named after its collector, who for nearly 40 years has acquired 862 artifacts from as far back as the 15th century, from all over the world.
“These maps are not intended primarily to communicate geographic information, but to send some sort of message to influence people’s opinions and beliefs,” said Mode ’60, a retired lawyer.
Mode donated his collection to Cornell in 2014 and has been adding to it over the years so that the maps can be preserved, digitized and shared “as widely and as easily as possible,” he said. “More than 50,000 people have used the collection website, from 172 countries and territories all over the world.”
The maps selected for the exhibit are meant to show a range of subject matter and themes from food to geopolitics, according to curator Lance Heidig. They also illustrate different visual techniques, “whether it’s the use of scale or color, or things that are left out versus things that are included,” Heidig said.
Heidig pointed to a Civil War-era map of the United States as an example: “The southern states appear larger than the northern states, as if to say, ‘Don’t let slavery take over.’”
He also noted the prominent use of animal imagery: “One of the great motifs in this exhibit is the octopus, used as a symbol for oppression or the spread of evil taking control.”
For Mode, these maps that were once meant to raise the pulse now serve to train the critical eye, inspiring viewers to look beyond the “who, what and where” and to ask the “why” behind maps and other visual representations of the world.
“Wherever I’ve shown or spoken about my collection,” Mode said, “inevitably someone always comes up to me and says, ‘I’ll never look at maps the same way again.’”
Mode and Heidig will lead an exhibit tour Oct. 3 at 3:30 p.m., followed by a reception from 4:30 to 6:30 p.m. The exhibit is supported by the Stephen E. ’58, MBA ’59, and Evalyn Edwards ’60 Milman Exhibition Fund.
Jose Beduya is a staff writer, editor and social media coordinator for Cornell University Library.
Media Contact
Get Cornell news delivered right to your inbox.
Subscribe