Snee Hall seismograph displays East Coast earthquake
By Anne Ju
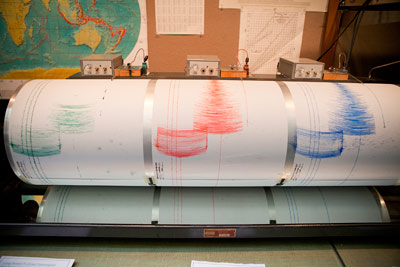
The Aug. 23 earthquake centered in Virginia that was felt along the East Coast, including in Ithaca, is on colorful display at Cornell.
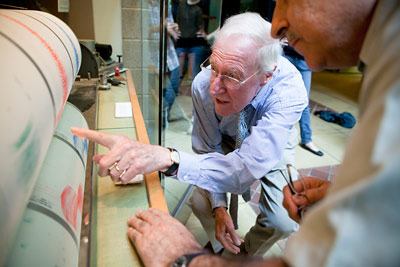
Cornell's seismograph, located in the lobby of Snee Hall, recorded the ground vibrations caused by the 5.8-magnitude quake, which took place just before 2 p.m. The colors represent different axes of motion; blue is the up-and-down movement of the ground below Snee, red is east-west and green is north-south. The seismograph displays information taken by seismometers located in the seismic vault, on a lower floor in Snee.
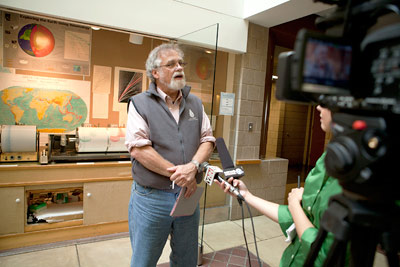
Earthquakes of this magnitude are relatively rare in the eastern United States, and poorly understood, said Larry Brown, professor of geological sciences in the Department of Earth and Atmospheric Sciences. "It's hard to deal with them as a threat because they are so unpredictable and rare," he said.
The recent event will provide plenty of opportunity for researchers to apply modern analysis techniques, including piecing together information from seismographs all over the country.
"The record we got was beautiful -- a great teachable moment," Brown said.
Get Cornell news delivered right to your inbox.
Subscribe