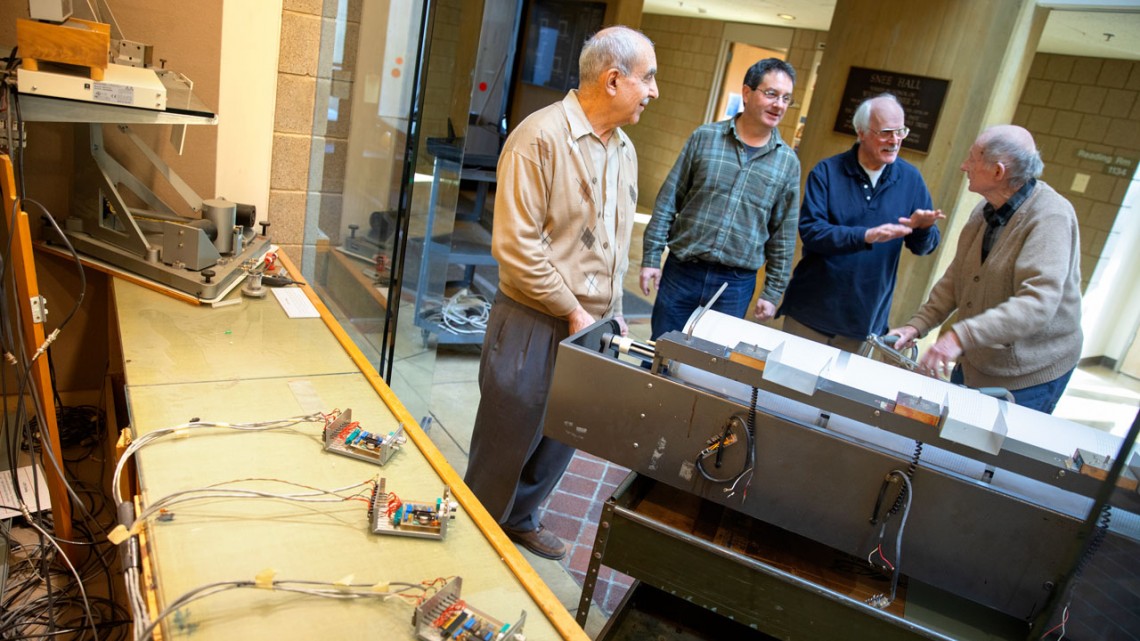
From left, emeritus professor Muawia Barazangi, left, professor Geoff Abers, emeritus professor Robert Kay and researcher George Hade decommission and remove the large drum seismograph Jan. 14, so the new display can be installed. The large drum seismograph had been used at Cornell since it was installed first in Kimball Hall in 1972 and then set up in Snee Hall in 1984.
Good vibrations: New display shows Earth’s quakes, quivers
By Blaine Friedlander
An LED display on the first floor of Snee Hall offers a modern way to monitor all of Earth’s quakes and continental gurgles – in real time. It replaces the Department of Geological Sciences’ seismograph, which was decommissioned in mid-January.
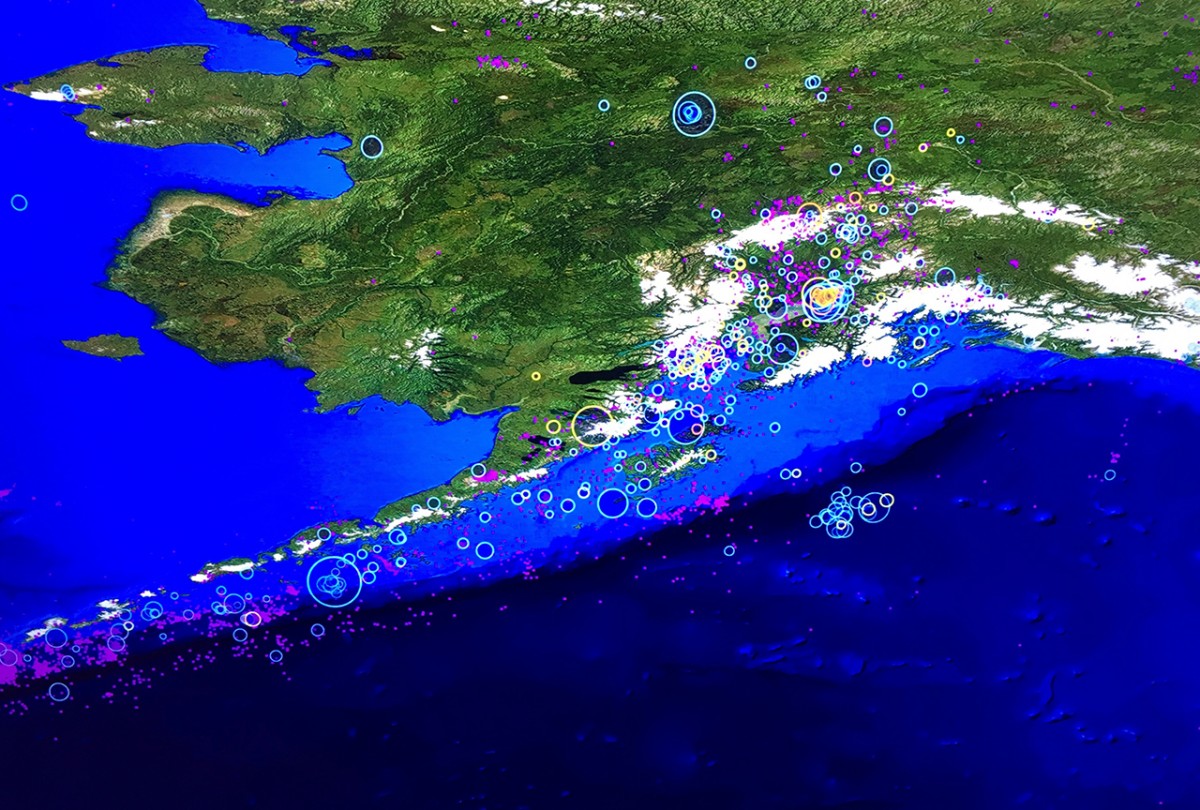
The new LED display on the first floor of Snee Hall shows most of the earthquakes around the world each day. Here, the display shows viewers the quantity of recent earthquakes throughout Alaska.
“This new display provides a sense of how much geologic activity there is all of the time, around the world,” said Geoffrey Abers, the William and Katherine Snee Professor in Geological Sciences. “The planet is incredibly dynamic.”
Where the old seismograph recorded vertical, north-south and east-west movement in red, green and blue ink on graph paper, one of the two new LED monitors taps into the Incorporated Research Institutions for Seismology, or IRIS, a university seismology consortium, to offer a global grand tour of the world’s geologic hot spots. The other monitor offers seismographs of specific places in real time.
Thus, whether examining Japan, the Caribbean or the Adriatic Sea, viewers can see hundreds of circles at any given time indicating recent earthquakes and their magnitude on the Richter scale.
Related Stories

“The Earth generates a few magnitude five earthquakes daily and magnitude fours every hour,” Abers said. “Many of these are recorded if there is a seismometer nearby.”
The new system can select from hundreds of different places from around the world, but the new Snee Hall display can display only three at a time. It shows how earthquakes promulgate at different distances and directions; the new system also makes it easy to compare sites.
Students can easily tap into this data. Each fall, Abers teaches the course Earthquake Record Reading (EAS 7800), where students analyze real-time geophysical data and conduct seismogram examinations of large earthquakes. They examine as many as 1,000 seismograms from one earthquake and study all facets of it.
Cornell’s Department of Civil and Environmental Engineering offers Earthquake Engineering Design (CEE 4070), and the Seismic Design Competition team participates in the national Earthquake Engineering Research Institute annual contest.
Abers has noticed an uptick in interest. “People have been telling me how they are amazed by so much geologic action and tell me, ‘I didn’t realize there were so many quakes,’” he said. “They’re asking me really interesting questions about aftershocks and foreshocks and why earthquakes are clustered in some places and don’t occur in others.
“The LED display maps have gotten people thinking a lot. There are a lot of people stopping and staring for a while,” he said. “It’s pretty illuminating.”
Media Contact
Get Cornell news delivered right to your inbox.
Subscribe