Labor scholars launch workforce strike, protest tracker
By Mary Catt
Although the U.S. Bureau of Labor Statistics tracks labor strikes, it only reports on those that involve 1,000 or more workers and last an entire shift. That approach leaves out most strike activities – and it doesn’t track labor protests at all.
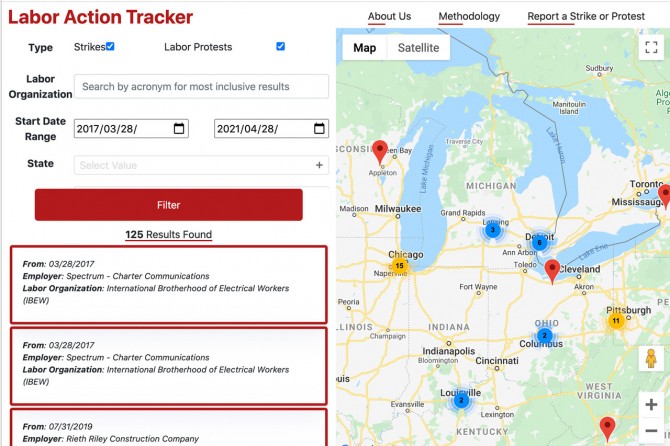
Filling that void was the motivation for building the Cornell ILR Labor Action Tracker, a new interactive map and database launched by the ILR School on May 1. It measures U.S. labor strikes and protests involving two or more people, capturing a far more accurate picture of labor activity across industries and around the country.
The tracker will enable a better understanding of the scope of labor unrest across the country, as existing data sources have limitations that leave policymakers and academics largely misinformed, according to project lead John Kallas, Ph.D. ’23; Eli Friedman, associate professor of international and comparative labor in the ILR School; and Dana Trentalange, MILR ’21, tracker coordinator and social media strategist. The launch timing was intentional: May 1 is International Workers’ Day, which has commemorated workers’ rights and strikes since the 1880s.
The tracker’s filters will enable, for instance, a search for strikes and protests related to workers’ concerns about COVID-19 protocols.
The searchable variables in the database include the employer; labor organization and local labor organization; industry; bargaining unit size; number of locations and address by city, state and zip code; whether it is a strike or a protest; approximate number of participants; start and end date and duration; union authorization; worker demands; and data source. The information will be linked directly to sources cited, Kallas said.
“We are excited that users are able to filter according to certain variables to develop a more specific understanding of strikes and labor protests. For example, users can filter by industry and search for all the strikes and/or labor protests in the health care sector,” Kallas said. “Users can also use multiple filters at once, which allows for even more specificity in terms of search results.”
Labor activists and scholars often eagerly await the Bureau of Labor Statistics’ annual work stoppage summary each February to examine strike trends, and many were surprised when the agency reported only eight large work stoppages in 2020, Kallas said. The low number underscores that the agency captures only a small number of strikes, he added.
“The U.S. Bureau of Labor Statistics provides open access to their methodology and the types of strikes they count, but a narrative is formed around their work stoppage data that is misleading. We have tracked at least eight strikes on our tracker in the past two weeks, let alone an entire year,” he said.
Although the tracker may be most useful for policymakers, academics and journalists, it can also be used by people who do not have a particular interest in labor, or who might not know much about unions or labor organizations, Kallas said. “For instance, we recently added two labor protests to our tracker that help illustrate this point. One featured a protest by approximately 2,000 food delivery drivers in New York City, which attracted limited press coverage by traditional news outlets. The other action featured unionized jockey valets protesting for a fair contract at Churchill Downs just a week before the Kentucky Derby.”
Ankit Mehta, MBA ’21, developed the interactive map and provided tech support. Victor Rieman ’21 helped track and add events to the interactive map.
Tracker updates can be followed on Twitter via @ILRLaborAction.
Mary Catt is director of communications at the ILR School.
Media Contact
Get Cornell news delivered right to your inbox.
Subscribe

