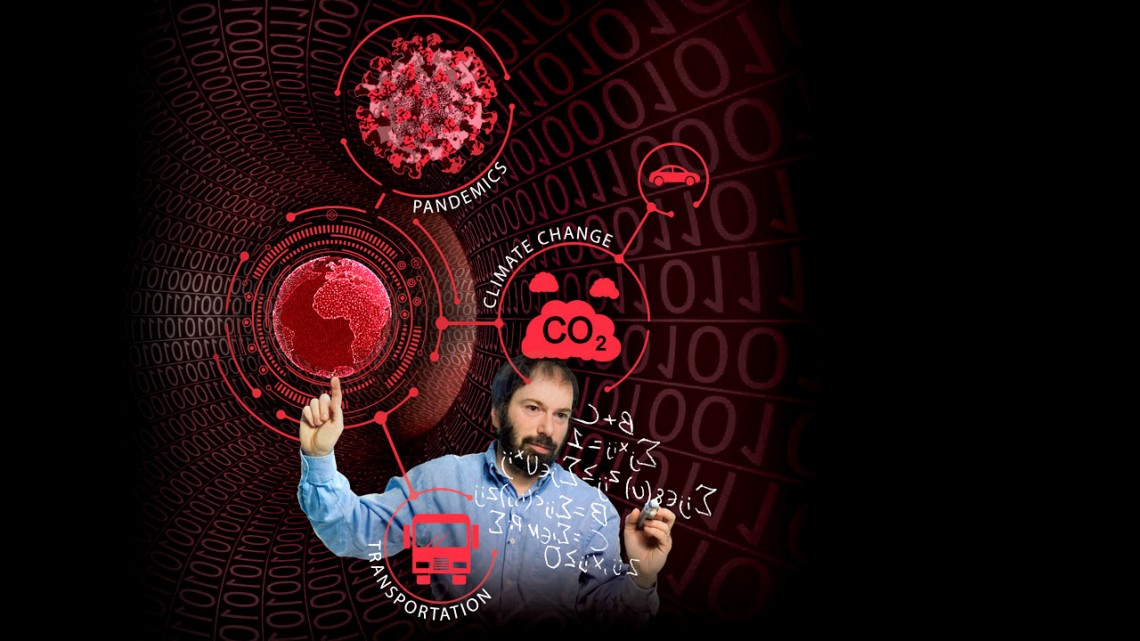
David Shmoys, the Laibe/Acheson Professor of Business Management and Leadership Studies, and other Cornell data scientists are developing models and mathematical techniques to address the world’s most vexing problems.
Big Red data: crunching numbers to fight COVID-19 and more
By Chris Woolston
Data scientists never really know where their work is going to take them.
David Shmoys, the Laibe/Acheson Professor of Business Management and Leadership Studies in the College of Engineering, has applied his mathematical tools to topics ranging from woodpecker populations to bike-sharing programs. When the COVID-19 global pandemic broke out, he shifted his attention to the biggest crisis of our time.
Over the years, Cornell data scientists have been developing models and mathematical techniques to address the world’s most vexing problems, from pandemics to climate change and transportation. Their collaborative efforts involve researchers spanning biology, the social sciences, physics and engineering. The work crosses disciplines and borders, benefiting critical-care units in New York City, hydroelectric dams on the Amazon and many places in between.
Using big data to address real-life problems is the guiding mission of three Cornell centers where much of the work takes place: the School of Operations Research and Information Engineering (ORIE); the Center for Data Science for Enterprise and Society, which Shmoys directs; and the Institute for Computational Sustainability.
“We’re using computational tools to improve decision-making capabilities,” Shmoys says. “We are especially attuned to problems that impact society.”
Data in a time of coronavirus
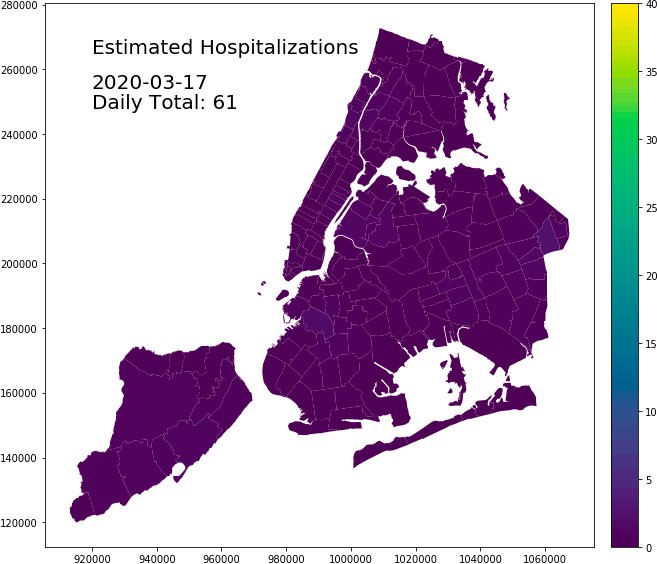
As the COVID-19 pandemic gained steam, Shmoys and colleagues began tracking the spread and developing models to predict the need for ventilators and other vital equipment.
A wide range of variables can affect the need for ventilators in New York City, and the facts on the ground were in constant flux. To build models to predict the most likely outcomes, Shmoys and colleagues collected data from around the world to learn more about transmission rates and the chances that an infection will lead to significant illness.
They’ve took a hyper-local view, tracking cases of coronavirus infections by ZIP code; it’s a critical piece of information for understanding the demographics of the disease at a neighborhood level. “You can think of this epidemic as multiple micro-epidemics,” Shmoys says, noting each has its own unique challenges.
This isn’t the first time Cornell data scientists have responded to a public health crisis. During the 2001 anthrax scare, John Muckstadt, now emeritus professor of operations research and information engineering, worked with Dr. Nathaniel Hupert at Weill Cornell Medicine to develop possible approaches to mass antibiotic distribution against the potential biological weapon.
“That set off a number of projects that explored both operational issues and system modeling approaches to improving medical care and understanding the progression of a disease,” Shmoys says. “It’s been a recurring theme of work within ORIE.”
Thinking big about coronavirus testing
On the COVID-19 front, Peter Frazier, associate professor in ORIE, has been crunching numbers on the best way to test large groups of people and potentially get them back to the workforce. “Even though we didn’t expect this pandemic, it’s very much in our wheelhouse,” Frazier says. “Our goal is to develop and apply math that’s useful and practical.”
The group testing approach was developed during World War II to screen soldiers for syphilis. The idea is to combine samples from a large number of people and test them all at once. If a combined sample from 100 people tests negative for COVID-19, researchers can assume that everyone who submitted a sample is free of the infection. In theory, those 100 people could then go about their day without fear of spreading the virus to others. If the sample is positive, the testers would have to go back to the original samples to zero in on affected people.
The approach is relatively simple in concept, but raises complicated mathematical questions: What is the optimum number of people to test at a time? How often do they need to be tested? The answers depend on many factors, including the prevalence of the virus.
“If one out of 10 people had the virus, testing 100 people at a time would be a waste because almost every sample would come back positive,” Frazier says. “But if the infection rate is more like one in 1,000, testing large groups of people makes more sense.”
Widespread group testing also would raise thorny logistical issues. “If you’re collecting saliva from 320 million people once a week, and delivering it to one of the 12 labs in the U.S.,” Frazier says, “that’s going to take a lot of cars and planes.”
If widespread testing becomes a reality, Cornell data scientists will be ready to offer mathematical guidance. “We have a lot of experience dealing with uncertainty,” he says.
Prior to COVID-19, Frazier had been working on the mathematics of group testing in a much different context: facial recognition in photographs. The mathematical concept is similar. When looking for faces, it helps to sample multiple locations at once. If there’s no face in that sample – that is, if the sample tests negative – the search continues elsewhere. If it comes back positive, the computer takes a closer look.
Computational sustainability
Like Shmoys and Frazier, Carla Gomes, professor of computer science and the director of the Institute for Computational Sustainability, applies mathematical techniques to a wide variety of problems. In computational sustainability, a field she helped pioneer, she uses data science to support conservation efforts. Her projects range from bird migrations to fishery quotas in Alaska and hydroelectric power in the Amazon.
But she always follows the same rule: She’ll only tackle the mathematics if she can collaborate with top conservation scientists who can guide her through the core issues. “I work on problems when I have access to the highest levels of expertise,” she says.
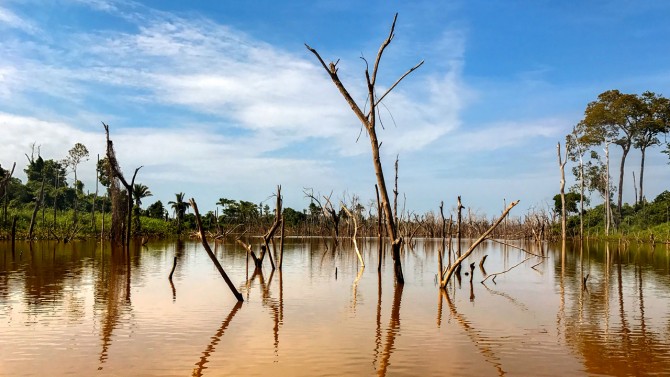
Gomes is working with Alex Flecker, professor of ecology and evolutionary biology in the College of Agriculture and Life Sciences, to understand how and where hydroelectric dams could be placed in the Amazon River basin to deliver the highest possible benefits with the least environmental downsides.
“Everybody thinks that hydropower is automatically clean energy, but there are a lot of trade-offs,” she says.
In 2019, Gomes, Flecker and an international team of co-authors found that giant reservoirs created by dams can become sources of methane, a potent greenhouse gas. “If you don’t plan properly,” Gomes says, “hydroelectric energy can be dirtier than coal.”
With hundreds of potential dam sites under consideration, choosing the best approach becomes an exercise in astoundingly large numbers. “I have a computer with one terabyte of memory that’s completely dedicated to keeping track of possibilities,” Gomes says. “The number of potential combinations exceeds the number of atoms in the universe.”
She also collaborates with R. Bruce van Dover, the Walter S. Carpenter Jr. Professor of Engineering, and others on developing materials for fuel cells, devices that turn fuel such as hydrogen into usable electricity. To find the right materials, Gomes, van Dover and colleagues are developing a robot named SARA (scientific autonomous reasoning agent) that uses artificial intelligence algorithms to test and develop possible options.
With so many possible applications for their mathematical approaches, Shmoys says, data scientists and their tools will almost certainly continue to play a role, as the world tackles the pandemic and its impact and whatever global crisis follows it.
“The advances in computational methods,” he says, “provide many opportunities.”
This article is adapted from the original, “Big Red Data,” by Chris Woolston, a freelance writer for the College of Engineering. The article appeared in the spring 2020 issue of Cornell Engineering magazine.
Media Contact
Get Cornell news delivered right to your inbox.
Subscribe